Use of digital tools, digital skills and mental well-being
In the digital age, information technology tools and environments play an important role in everyday life – in learning, communicating, using services and elsewhere. This is why, in 2006, the European Parliament included digital competence among the eight key competences of the 21st century. A key competence is a combination of knowledge, skills and attitude that all people need to ensure success, self-realisation and personal development, active citizenship, social inclusion and employment. Therefore, digital competence is vital for all people, regardless of age.
Digital competence is the ability to use information and communication technology to benefit oneself and others in everyday life and reduce potential harm.Digital competence incorporates several digital skills, such as information management and data literacy, communication and collaboration, digital content creation, safety and problem-solving..
Problems with the use of digital tools, including a lack or low level of digital competence, are considered social deprivation. Social deprivation increases the risk of exclusion, which in turn affects mental health and wellbeing. Children, youth and older people are the most vulnerable. The relationships between digital competence and mental wellbeing manifest in different ways at different ages. These complex and indirect associations in children and youth have not been researched extensively. vidence shows that young people’s better digital skills are linked to their greater experience with online risks, but there are no links to online harm. Greater digital competence may reduce harm, as digitally competent young people are better able to cope with online risks (Haddon et al. 2020).
While technology is regarded as a stimulating environment for successful ageing, the rapid development of technology also creates psychological pressure in older people. Research reveals that the use of digital tools in older age improves the quality of life, subjective well-being and self-reported health. Older people are discouraged by their lack of digital competence(Tambaum 2021). When managing the digital environment becomes too much for older people, they tend to blame themselves and their age and feel they are of less value.
In this article, we look at the mental well-being and coping of two vulnerable groups – Estonians aged 12 to 16 and those older than 50 – in a rapidly changing digital environment and compare this with international results. We focus on the links between mental well-being and the use of digital tools and self-reported digital or computer skills.
A network of researchers from more than 30 countries who aim to help children be safer and more aware of the internet EU Kids Online has studied the main trends in young people’s internet use in Europe, including Estonia. This article is based on data from the second round of the EU Kids Online survey,1 conducted mainly in 2018 in 19 European countries, among children aged 9 to 17 and their parents (N = 25,101). We look at 12-to-16-year-old internet users in our analysis, since in most countries only adolescents were surveyed about digital skills and mental wellbeing, and 17-year-olds were not included in some countries. For comparability, we included 16 countries (N = 12,018) with weighted data representative of the general population.
The EU Kids Online survey measured young people’s mental well-being on a scale of emotional problems consisting of four statements (‘I worry a lot’, ‘I am nervous in certain new situations; I easily lose confidence’, ‘I am often unhappy, sad or tearful’, ‘I have many fears and I am easily scared’; response scale 1 – not true for me … 4 – very true for me) and on a life satisfaction scale (‘Imagine that the top of the ladder “10” is the best possible life for you and the bottom “0” is the worst possible life for you. In general, where on the ladder do you feel you stand at the moment?’)
We assume that the digital environment, where young people operate every day, influences their mental wellbeing.
The EU Kids Online survey reveals that young people who perceive the digital environment as safe have somewhat fewer emotional problems (Pearsoni r = -0,11; p < 0,001). The same pattern is evident when comparing the average aggregate indicators of the countries (see Figure 4.1.1; Pearsoni r = -0,47; p = 0,07).
On the international comparison matrix (Figure 4.1.1) Estonia‘s young people have slightly fewer emotional problems than the average in the 16 European countries, but their perceived safety of the digital environment is significantly higher than the average in the 16 countries. Estonia is most similar to other countries in the Scandinavian and Baltic region – Lithuania and Norway.For example, only 3% of 12-to-16-year-olds in Estonia stated that they never feel safe on the internet, while more than 14% of young people in Romania, Italy and Switzerland agreed with that statement (Figure 4.1.2).
One in seven Estonian adolescents stated that they are often unhappy or tearful (Figure 4.1.2), which indicates a serious problem in their mental well-being. The average level of unhappiness was higher in eight countries and lower in seven. Thus, according to one of the main indicators and the aggregate feature consisting of four indicators presented Figure 4.1.1 Estonia falls within the average of the European countries studied in terms of the prevalence of emotional problems among young people.
J4.1.1.R
maiko.koort
2023-07-13
library(ggplot2)
#faili sisselugemine ja andmete formaadi korrigeerimine
J411=read.csv("PT4-T4.1-J4.1.1.csv",header=TRUE, encoding ="UTF-8")
names(J411)=gsub("\\.", " ", names(J411))
J411$Riik[J411$Riik=="Russia"]="Serbia"
#joonis
ggplot(J411)+
geom_point(aes(x=`Emotsionaalsed probleemid`,y=`Digikeskkonna turvalisus`),cex=3,col="#FF3600")+
geom_label(aes(x=`Emotsionaalsed probleemid`+0.02,y=`Digikeskkonna turvalisus`+0.04,label=Riik),cex=3,col="#668080",fontface="bold",alpha=0.5)+
theme_minimal()+
geom_abline(aes(slope=0, intercept=1.386875),col="#668080")+
geom_vline(xintercept=1.825,col="#668080")+
theme(text = element_text(color="#668080"),axis.text=element_text(color="#668080"))+
scale_x_continuous(breaks=seq(1.2,2.2,0.2))+
scale_y_continuous(breaks=seq(0.5,2.5,0.5))+
xlab("Emotional problems")+
ylab("Safety of the digital environment")
J4.1.2.R
maiko.koort
2023-07-13
library(ggplot2)
library(tidyr)
#faili sisselugemine ja andmete formaadi korrigeerimine
J412=read.csv("PT4-T4.1-J4.1.2.csv",header=TRUE, encoding ="UTF-8")
names(J412)=gsub("\\.", " ", names(J412))
J412=pivot_longer(J412,2:3)
J412$Riik[J412$Riik=="Estonia"]="ESTONIA"
J412$Riik=as.factor(J412$Riik)
J412$Riik=factor(J412$Riik, rev(levels(J412$Riik)))
J412$name[J412$name=="I am often unhappy, sad or tearful"]="I am often unhappy, sad or tearful"
J412$name=as.factor(J412$name)
J412$name=factor(J412$name, rev(levels(J412$name)))
font=rep(1,16)
font[16]=2
#joonis
ggplot(J412)+
geom_col(aes(x=Riik,y=value,fill=name),pos=position_dodge(0.9),width=0.7)+
geom_label(aes(x=Riik,y=value,label=value,group=name),pos=position_dodge(0.8),cex=2.4)+
theme_minimal()+
coord_flip()+
scale_fill_manual(values=c("#323E4E","#FF3600"),breaks=rev(levels(J412$name)))+
scale_y_continuous(breaks=seq(0,25,5))+
theme(axis.text.y = element_text(face=font))+
xlab("")+
ylab("")+
theme(legend.title = element_blank())## Warning: Vectorized input to `element_text()` is not officially supported.
## ℹ Results may be unexpected or may change in future versions of ggplot2.
Digital competence plays an important role in coping with modern life. Therefore, we hypothesised that young people’s digital skills are related to another indicator of mental wellbeing – life satisfaction. A weak link was revealed: European teenagers who consider themselves more digitally competent tended to be slightly more satisfied with their lives.
Estonia is among the countries where the average indicators of both young people’s life satisfaction and self-reported digital skills are slightly higher than in the other countries studied (Figure 4.1.3). Lithuania stands out among neighbouring countries: young people’s self-reported digital skills are significantly higher, while the level of life satisfaction is considerably lower.
4.1.3.R
maiko.koort
2023-07-13
library(ggplot2)
#faili sisselugemine ja andmete formaadi korrigeerimine
J413=read.csv("PT4-T4.1-J4.1.3.csv",header=TRUE, encoding ="UTF-8")[,1:3]
names(J413)=gsub("\\.", " ", names(J413))
J413$Riik[J413$Riik=="Russia"]="Serbia"
#joonis
ggplot(J413)+
geom_point(aes(x=`Eluga rahulolu`,y=`Digioskused`),cex=3,col="#FF3600")+
geom_label(aes(x=`Eluga rahulolu`-0.02,y=`Digioskused`+0.02,label=Riik),cex=3,position=position_dodge(0.01),color="#668080",fontface="bold")+
geom_abline(aes(slope=0, intercept=4.064286),color="#668080")+
geom_vline(xintercept=7.252143,color="#668080")+
theme_minimal()+
theme(text = element_text(color="#668080"),axis.text=element_text(color="#668080"))+
scale_x_continuous(breaks=seq(6.5,8,0.25))+
scale_y_continuous(breaks=seq(3.7,4.3,0.1))+
xlab("Life satisfaction")+
ylab("Digital skills")
In summary, the indicators of mental wellbeing of Estonian youth aged 12 to 16 are average or satisfactory compared to 16 other European countries. Among other things, the fact that Estonian adolescents perceive the digital environment as relatively safe and that their digital skills are good compared to other countries could play a role in this. Unlike in some other countries, there are no gender or age gaps in the digital skills of young people in Estonia (Smahel et al. 2020, lk 37–38).
The role of the digital environment in shaping mental wellbeing must be viewed in a broader context and considering social inequality. For this, we first analysed Estonian adolescents’ emotional problems and life satisfaction by gender, age, ethnicity, type of residence and perceived socioeconomic status (vt Figure 4.1.4). Emotional problems are significantly more prevalent in girls (significant difference level p < 0.001) and somewhat more prevalent in 15-to-16-year-olds (p = 0.06). Furthermore, older adolescents have a slightly lower life satisfaction (p = 0.08).
We used self-reported social status to indicate the socioeconomic dimension. It was measured on a ten-step social ‘ladder’, where the respondents could place themselves and their family based on wealth and parents’ level of education and employment position. As expected, young people’s life satisfaction is strongly correlated with perceived social status (p < 0.001): adolescents who place themselves in the lower stratum (ranking 0–5) are the least satisfied with their lives, and those placed in the higher stratum (ranking 8–10) rate their life satisfaction the highest (Figure 4.1.4). Young people’s emotional problems do not depend on the socioeconomic dimension. The mental well-being of Estonian youth is not related to ethnicity (based on response language) or type of residence (size of settlement).
J4.1.4.R
maiko.koort
2023-07-26
library(ggplot2)
library(tidyr)
#faili sisselugemine ja andmete formaadi korrigeerimine
J414=read.csv("PT4-T4.1-J4.1.4.csv",header=TRUE, encoding ="UTF-8")
names(J414)=gsub("\\.", " ", names(J414))
J414=pivot_longer(J414,2:3)
J414$X=as.factor(J414$X)
J414$X=factor(J414$X,levels(J414$X)[order(c(5,4,2,8,1,3,7,6))])
#joonis
ggplot(J414)+
geom_col(aes(x=X,y=value,fill=name),pos=position_dodge(1),width=0.7)+
geom_text(aes(x=X,y=value+0.3,group=name,label=value),pos=position_dodge(0.8),size=3)+
coord_flip()+
scale_fill_manual(values=c("#6666cc","#ff3600"),breaks=c("Emotional problems","Life satisfaction"))+
theme_minimal()+
theme(text = element_text(color="#668080"),axis.text=element_text(color="#668080"))+
scale_y_continuous(breaks=seq(0,10,2))+
theme(legend.position = "bottom")+
theme(legend.title = element_blank())+
xlab("")+
ylab("")
In order to find out what the mental well-being of Estonian youth depends on the most
we analysed gender, age and social status alongside personality traits and characteristics describing the digital environment, school and family environment in regression analysis models. The personality traits and environmental characteristics we tested included the sensation seeking, the safety of the digital environment, digital skills, the variety of online activities, parental and teacher mediation of internet use, and support from peers and friends. The model in which being female, perceived discrimination (bullying) and self-reported excessive internet use played the biggest role was the best in predicting the likelihood of emotional problems (Table 4.1.1).
Self-efficacy is an individual’s belief that they can cope with goals, tasks, new situations and problems. Among European and Estonian youth, self-efficacy is strongly related to digital competence (Mascheroni et al. 2020). In the digital age, self-efficacy increases with growing digital competence, which in turn promotes mental wellbeing.
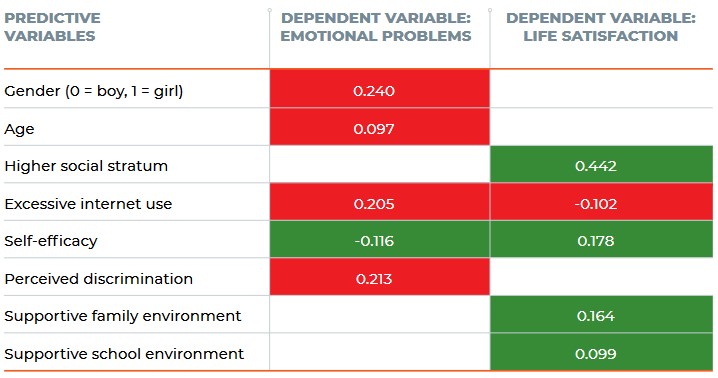
Higher self-reported social status, high self-efficacy and a supportive family environment (meaning that their family listens to them and provides help) best predict life satisfaction in adolescents. A lower level of self-reported excessive internet use and a supportive school environment (supportive fellow students and teachers) are also important.
Therefore, the mental well-being of Estonian youth is largely influenced by individual traits and the immediate social environment. Self-reported excessive internet use turned out to be the most important digital environment trait. In more serious cases, this could also be connected to mental health problems (Sisask and Streimann 2020).
The international longitudinal study SHARE studies Estonians aged 50 and over and their use of digital tools, self-reported digital skills and subjective wellbeing, quality of life and cognitive abilities.(Survey on Health, Ageing and Retirement in Europe). In Estonia, more than 7,500 people aged 50 and over have been surveyed every other year since 2011. The following questions were asked about the use of digital tools in 2013 and 2015: Have you used the internet at least once in the past seven days to send e-mails, search for information, make purchases or for other purposes?’ Self-reported digital skills were measured with the question ‘How would you rate your computer skills? Would you say they are… excellent, very good, good, fair, poor?’ There was another option: ‘I never used a computer’ (checked only if the respondent said this spontaneously).
In 2015, 38% of people aged 50 and over in Estonia had never used a computer; two years earlier, the same figure was 45% (Tambaum 2019). According to this measure, Estonia ranks only slightly above the average among 18 European countries. As expected, older people are the most likely group not to use computers, but, for example, 20% of men and 13% of women aged 55 to 64 had never used a computer (Figure 4.1.5).
J4.1.5.R
maiko.koort
2023-07-13
library(ggplot2)
library(tidyr)
#faili sisselugemine ja andmete formaadi korrigeerimine
J415=read.csv("PT4-T4.1-J4.1.5.csv",header=TRUE, encoding ="UTF-8")[,1:6]
names(J415)=c("Sugu","<=54","55-64","65-74","75-84","85+")
J415=J415[2:3,]
J415=pivot_longer(J415,2:6)
#joonis
ggplot(J415)+
geom_col(aes(x=name,y=value,fill=Sugu),pos=position_dodge(0.9),width=0.7)+
theme_minimal()+
theme(text = element_text(color="#668080"),axis.text=element_text(color="#668080"))+
scale_fill_manual(values=c("#323E4E","#ff3600"))+
xlab("")+
ylab("%")+
theme(legend.title = element_blank())
Computer and internet use by middle-aged and older people is primarily influenced by external circumstances, especially whether they needed to use a computer in their current or most recent job. Only 16% of employed people do not use computers and the internet. This figure is 60% among not employed respondents. Estonian men between the ages of 55 and 64 differed the most from other SHARE countries. Half of Estonian men of this age did not use the internet regularly, while in the other countries the figure is 30%. Men who live with a partner use the internet more than those who live alone (39% and 56%, respectively). Estonian older adults’ relative lag in digital skills is also evident in the use of public e-services. This, in turn, points to years of unequal treatment in communication with the state and in participation in democratic governance (Solvak et al. 2019).
The main reason older adults do not use the internet in Estonia and Europe is not the absence of opportunities but the lack of skills. The PIAAC survey (Programme for the International Assessment of Adult Competencies) revealed that although older people in Estonia are outstanding in both functional reading and mathematical literacy, their problem-solving skills in a technology-rich environment are weak (Halapuu and Valk 2013). According to the SHARE survey, 64% of people who used the internet in 2015 evaluated their computer skills as poor or very poor (Figure 4.1.6).
J4.1.6.R
maiko.koort
2023-07-13
library(ggplot2)
library(tidyr)
#faili sisselugemine ja andmete formaadi korrigeerimine
J416=read.csv("PT4-T4.1-J4.1.6.csv",header=TRUE, encoding ="UTF-8")[1:4]
J416$X[J416$X=="Estonia"]="ESTONIA"
names(J416)=gsub("\\.", " ", names(J416))
levels=J416$X=reorder(J416$X, J416$bad)
J416=pivot_longer(J416,2:4)
J416$name=as.factor(J416$name)
J416$X=as.factor(J416$X)
J416$X=factor(J416$X, levels)
font=rep(1,18)
font[15]=2
#joonis
ggplot(J416)+
geom_col(aes(x=X,y=value,fill=name))+
theme_minimal()+
scale_fill_manual(values=c("#ff3600","#81DBFE","#1E272E"))+
theme(text = element_text(color="#668080"),axis.text=element_text(color="#668080"))+
xlab("")+
ylab("%")+
theme(axis.text.x = element_text(angle = 90,face=font))+
theme(legend.title = element_blank())## Warning: Vectorized input to `element_text()` is not officially supported.
## ℹ Results may be unexpected or may change in future versions of ggplot2.
The data of the two SHARE survey waves show that self-reported digital skills tend to decrease over time. In the space of three years (2013–2015), only 5% of Estonians who were 55 to 64 years old in 2015 and participated in both waves acquired computer literacy. In the same group, 17% experienced a drop in self-reported skills, and 5% assessed their skills as having become nonexistent. On the one hand, the deterioration of digital skills is related to changes in the lives of people in the observed age group, such as leaving the workforce.
On the other hand, these skills are dynamic, as digital technology changes and develops constantly, and subjective self-reports are influenced, among other things, by how other age groups’ increasing skills are perceived.
When learning through imitation, new skills are acquired, but with no complex understanding, so the person cannot transfer the skills to a changed situation.
At first glance, it is surprising that the higher the respondent’s level of education, the more likely self-reported skills were to decrease over time (Figure 4.1.7). People with higher education are probably more likely to take part in digital skills courses without a specific goal, just in case. If the training does not help with applying the skills and no further training is provided as technology progresses, the skills will disappear. This can explain why the change in skills over time is greater among the highly educated than among the less educated. It is also common for people to pick up unskilled jobs as they get older, and the digital skills they acquired for a profession are no longer needed.
J4.1.7.R
maiko.koort
2023-07-13
library(ggplot2)
library(tidyr)
library(scales)
#faili sisselugemine ja andmete formaadi korrigeerimine
J417=read.csv("PT4-T4.1-J4.1.7.csv",header=TRUE, encoding ="UTF-8")[1:7,1:5]
names(J417)=c("X","1st quartile
< 9 yr in education","2nd quartile
9–11 yr" ,"3rd quartile
12–13 yr in education", "4th quartile
> 13 yr in education")
J417=pivot_longer(J417,2:5)
J417$X=as.factor(J417$X)
J417$X=factor(J417$X, levels(J417$X)[order(c(6,3,5,2,4,1,7))])
#joonis
ggplot(J417)+
geom_col(aes(x=name,y=value,fill=X))+
theme_minimal()+
scale_fill_manual(values=c("#81DBFE","#6666cc","#668080","#f09d00","#bf6900","#FF3600","#982F1A"))+
theme(text = element_text(color="#668080"),axis.text=element_text(color="#668080"))+
xlab("")+
ylab("%")+
theme(legend.title = element_blank())+
scale_x_discrete(labels = wrap_format(10))
Depressiveness and loneliness in middle-aged and older adults and their association with digital skills
In the SHARE study, depressive symptoms are assessed with the EURO-D scale, which includes low mood, suicidal ideation, pessimism, guilt, irritability, feeling lonely, changes in sleep and appetite, lack of interest, fatigue, decreased concentration, tearfulness and lack of enjoyment. A person who reports at least three of these symptoms coming up in the previous four weeks is considered depressive (Abuladze et al. 2020).
Loneliness – the lack of meaningful human relationships and communication – is one of the symptoms and risk factors of depressive symptoms. Loneliness is measured in the SHARE survey on the R-UCLA three-point scale, asking the respondents how often they feel a lack of companionship or isolated from others. Total points on the scale range from 3 to 9. People with 5–9 points are considered very lonely; those with 4 points are considered moderately lonely; and those with 3 points are considered not lonely.
Among European countries, Estonia has one of the highest rates of depressiveness in middle-aged and older people. According to 2011 data, 42% of people in Estonia aged 50 and over were depressive. In 2013, this figure dropped to 34%, and in 2015, it stayed the same. Figure 4.1.8 shows the change by gender and birth cohort. In general, depressiveness is more prevalent in women and people aged 80 and over – more than half of them reported depressive symptoms in all waves of the survey.
J4.1.8.R
maiko.koort
2023-07-13
library(ggplot2)
library(tidyr)
library(scales)
#faili sisselugemine ja andmete formaadi korrigeerimine
J418=read.csv2("PT4-T4.1-J4.1.8.csv",header=TRUE, encoding ="UTF-8")
names(J418)=gsub("X", " ", names(J418))
names(J418)=gsub("\\.", "-", names(J418))
J418=pivot_longer(J418,2:4)
J418$value=as.numeric(J418$value)
#joonis
ggplot(J418)+
geom_col(aes(x=name,y=value,fill=Birth_cohort), pos=position_dodge(0.8),width=0.7)+
theme_minimal()+
facet_grid(~Sugu)+
scale_fill_manual(values=c("#81DBFE","#6666cc","#f09d00","#bf6900"))+
theme(text = element_text(color="#668080"),axis.text=element_text(color="#668080"))+
theme(strip.text.x=element_text(color="#668080"))+
xlab("")+
ylab("%")
#theme(legend.title = element_blank())There are few very lonely people in Estonia – 2.0% of the total sample in 2013 and 2.2% in 2015 (Figure 4.1.9). Very high loneliness is more common in old age; differences between genders are less noticeable here. In 2013, 5.6% of men born in the 1920s were very lonely; in 2015 this figure increased to 10.3% (the figures are similar among women). Nmong younger people, the respective indicators are in the range of 1.0–1.5%. People with less education (eight years or less) have a higher risk of loneliness than those with a more years spent in education.
J4.1.9.R
maiko.koort
2023-07-13
library(ggplot2)
library(tidyr)
#faili sisselugemine ja andmete formaadi korrigeerimine
J419=read.csv2("PT4-T4.1-J4.1.9.csv",header=TRUE, encoding ="UTF-8")
names(J419)=gsub("X", "", names(J419))
J419=pivot_longer(J419,2:3)
J419$value=as.numeric(J419$value)
#joonis
ggplot(J419)+
geom_col(aes(x=name,y=value,fill=Birth_cohort), pos=position_dodge(0.8),width=0.7)+
theme_minimal()+
facet_grid(~Sugu)+
scale_fill_manual(values=c("#81DBFE","#6666cc","#f09d00","#bf6900"))+
theme(text = element_text(color="#668080"),axis.text=element_text(color="#668080"))+
theme(strip.text.x=element_text(color="#668080"))+
xlab("")+
ylab("%")
SHARE 2015 data reveals that Eastern European countries have some of the highest rates of lonely men. The rates of lonely women are highest in Southern Europe and the Mediterranean countries, followed by Eastern Europe.
The number of depressive symptoms among middle-aged and older people who use the internet is somewhat lower than among non-users in Estonia and the other countries that participated in the survey. Also, not using the internet has a significant connection to loneliness.
The occurrence of depressiveness is also significantly related to the level of computer literacy. The more literate people were, the fewer depressive symptoms they had on average, among both men and women in Estonia and in the other countries (Figure 4.1.10).
J4.1.10.R
maiko.koort
2023-07-13
library(ggplot2)
library(tidyr)
library(stringr)
#faili sisselugemine ja andmete formaadi korrigeerimine
J4110=read.csv("PT4-T4.1-J4.1.10.csv",header=TRUE, encoding ="UTF-8")[,1:5]
J4110x=J4110[c(1,4,7,10),]
names(J4110x)=gsub("\\.", " ", names(J4110x))
names(J4110x)[5]="(Very) good"
J4110x=separate(J4110x,X,into=c("Riik","Sugu"),sep=" ")
J4110x$Sugu=str_to_title(J4110x$Sugu)
J4110x=pivot_longer(J4110x,3:6)
J4110x$low=as.vector(t(J4110[c(2,5,8,11),2:5]))
J4110x$high=as.vector(t(J4110[c(3,6,9,12),2:5]))
J4110x$Riik=as.factor(J4110x$Riik)
J4110x$Riik=factor(J4110x$Riik,levels(J4110x$Riik)[order(c(2,1))])
J4110x$name=as.factor(J4110x$name)
J4110x$name=factor(J4110x$name,levels(J4110x$name)[order(c(4,2,1,3))])
#joonis
ggplot(J4110x)+
geom_point(aes(x=name,y=value,col=Sugu),cex=3)+
geom_errorbar(aes(x=name,y=value,ymin=low,ymax=high,col=Sugu),width=0.2,linewidth=0.8)+
theme_minimal()+
facet_grid(~Riik)+
scale_y_continuous(breaks=seq(0,4,1),limits=c(0,4))+
theme(legend.position = "bottom")+
theme(legend.title = element_blank())+
scale_color_manual(values=c("#6666cc","#F25D23"))+
theme(text = element_text(color="#668080"),axis.text=element_text(color="#668080"))+
theme(strip.text.x=element_text(color="#668080"),strip.text.y = element_text(color="#668080"))+
xlab("Computer literacy level")+
ylab("Depressive symptoms (EURO-D)")
To study depressive symptoms (EURO-D scale) and loneliness during the first wave of the COVID-19 pandemic2 and their association with digital skills, people aged 50 and over taking part in the SHARE panel survey were interviewed by phone in June and July 2020
In general, the first wave of the coronavirus pandemic did not have a significant impact on the loneliness and depressiveness of the middle-aged and older people in Estonia. During the first wave of the pandemic, there were very few cases of COVID-19 in Estonia, and so the new situation may not have affected people’s health much yet.
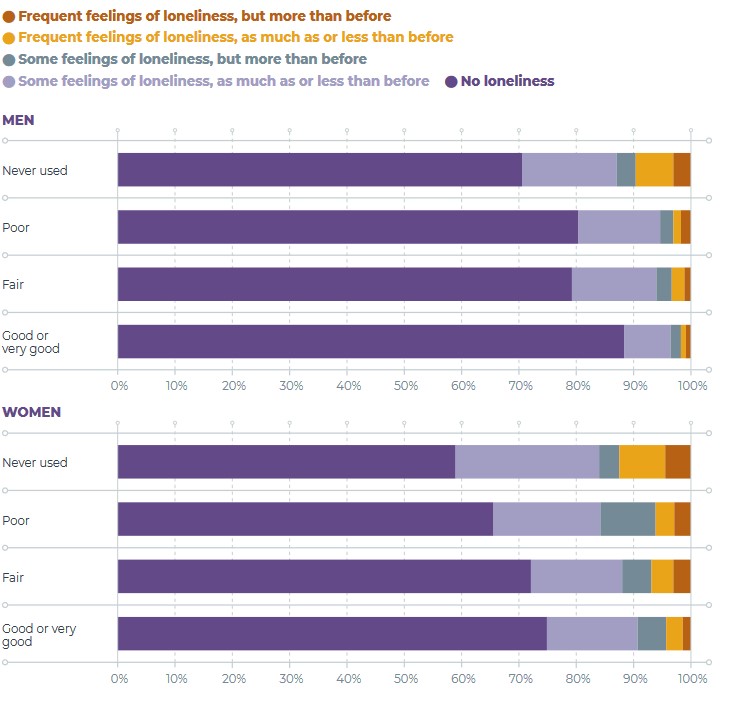
Among internet users, 16% of men and 26% of women felt lonely before the pandemic and during the COVID-19 restrictions as well. The corresponding indicators were higher among non-users: 27% of men and 39% of women were lonely. There were no differences in depressiveness between internet users and non-users. People with higher computer literacy were also less lonely (Figure 4.1.11), both before and during the first wave of the pandemic.
People aged 50 and over who rarely or never communicated with their children were more likely to feel lonely. Changes in communicating with other people were not clearly related to loneliness. It is possible that when the COVID-19 restrictions were introduced, the use of technological tools increased mainly because of the need to communicate with people close to one. People who had less contact with their children overall used computers less during the coronavirus pandemic.
Summary
Using digital tools and developing the necessary skills is not just another interesting activity for young people or middle-aged and older people – it is closely connected to their mental well-being. The situation of Estonian 12-to-16-year-olds is satisfactory in comparison with the other European countries studied, but there is room for improvement in the development of young people’s digital competence and mental wellbeing.
Although Estonian adolescents perceive the digital environment as quite safe and their self-reported digital skills are relatively good, a significant number of young people have emotional problems. The mental well-being of Estonian youth is largely influenced by individual traits, especially self-efficacy, and the immediate social environment – a supportive family and school, and relationships with peers. Self-reported internet overuse turned out to be the most important trait related to the digital environment. This could lead to a vicious circle: excessive use of the internet causes problems at home and school, and without finding support and help, young people escape even further into the depths of the online world.
The situation of middle-aged and older people in Estonia is more problematic. Although their average indicators of loneliness are lower than in most of the European countries examined, the level of depressiveness among people aged 50 and over in Estonia is one of the highest in Europe. The prevalence of depressiveness and the risk of loneliness increase with age, but age should not be considered the main or the direct cause of mental health problems. Since, among middle-aged and older people, not using the internet and having little or no computer literacy are significantly related to both depressiveness and loneliness, the causes of problems with mental well-being are related, among other things, to their ability to function in the digital environment. The period of COVID-19 restrictions clearly showed that more frequent communication with children and using technological tools is associated with less depressiveness and feelings of loneliness.
Unfortunately, Estonian people aged 50 and over report their computer literacy as relatively poor in the context of other European countries, and their subjective perception of their lag in skills rather increases over time. Furthermore, a digital divide is evident in this age group: older people, people with a lower level of education and not employed people are significantly more likely to have lower computer literacy.
The generational digital divide, or the problem of middle-aged and older people not using digital tools or having few skills, is not the problem of one or two generations (Tambaum 2021). Although different issues affect the mental well-being of young and older internet users, the ways and the contexts of acquiring new skills and the ways of providing instruction are increasingly important for both groups. When teaching older people outside the home, the instructors should be people who know not only how to use digital tools but also how to share those skills (Tambaum 2021). In addition to digital skills, young people need to develop their self-efficacy and social sensitivity and learn self-management and social coping skills.
Abuladze, L.; Opikova, G.; Lang, K. (2020). Factors associated with incidence of depressiveness among the middle-aged and older Estonian population. SAGE Open Medicine, 8, 1−12. DOI: 10.1177/2050312120974167.
Haddon, L., Cino, D., Doyle, M.-A., Livingstone, S., Mascheroni, G., & Stoilova, M. (2020). Children’s and young people’s digital skills: A systematic evidence review. Horizon 2020 ySKILLS Project, Work Package 2 – Deliverable 2.1.
Halapuu, V. & Valk, A. (2013). Täiskasvanute oskused Eestis ja maailmas. PIAAC uuringu esmased tulemused. Tartu: Haridus- ja Teadusministeerium.
Mascheroni, G., Cino, D., Mikuška, J., Lacko, D., & Šmahel, D. (2020). Digital skills, risks and wellbeing among European children: Report on (f)actors that explain online acquisition, cognitive, physical, psychological and social wellbeing, and the online resilience of children and young people. Horizon 2020 ySKILLS Project, Work Package 2 – Deliverable 2.2.
Sisask, M. ja Streimann, K. (2020). Noorte vaimne tervis. Noorteseire aastaraamat 2019–2020. Tallinn: Eesti Noorsootöö Keskus, 29-53.
Smahel, D., Machackova, H., Mascheroni, G., Dedkova, L., Staksrud, E., Ólafsson, K., Livingstone, S., Hasebrink, U. 2020. EU Kids Online 2020: Survey results from 19 countries. EU Kids Online. https://doi.org/10.21953/lse.47fdeqj01ofo.
Solvak, M., Unt, T., Rozgonjuk, D., Võrk, A., Veskimäe, M., Vassil, K. 2019. E-governance diffusion: Population level e-service adoption rates and usage patterns. – Telematics and Informatics, 36, 39–54. https://doi-org.ezproxy.tlu.ee/10.1016/j.tele.2018.11.005.
Tambaum, T. 2019. Vanemas tööeas inimeste internetikasutus ja sotsiaalne aktiivsus SHARE Eesti nelja laine andmetel (Internet use and social activity among young-old population over the four waves of SHARE). – Sakkeus, L., Tambaum, T. (toim). Pilk hallile alale II. Vananemine elukaare vaates. SHARE Eesti uuringu teine ülevaade. Tallinn: Tallinna Ülikooli Eesti Demograafia Keskus, 71–84.
Tambaum, T. (2021). Teenaged tutors facilitating the acquisition of e-skills by older learners. Tallinna Ülikool. Doktoritöö, seeria 145. www.etera.ee/zoom/145154/view .
[1] EU Kids Online’i Eesti 2018. aasta küsitlust rahastasid Eesti Interneti SA, Haridus- ja Teadusministeerium (Euroopa Sotsiaalfondist), Justiitsministeerium, Sotsiaalministeerium ning uurimisprojektid PUT 44 (Eesti Teadusagentuur) ja IUT 20-38 (Haridus- ja Teadusministeerium) ning andmed kogus Turu-uuringute AS.
[2] Üksildustunnet mõõdeti SHARE COVIDi ankeedis kahe küsimusega: 1) Kui tihti te tunnete üksindust? Kas … 1. Sageli 2. Mõnikord 3. Peaaegu mitte kunagi või mitte kunagi; ning 2) Kas seda oli rohkem, vähem või enam-vähem sama palju võrreldes koroonaviiruse puhangu eelse ajaga? 1. Rohkem 2. Vähem 3. Umbes samamoodi.